Automatic Support & Pivots
Find the support level from clustered prices, and mark the swing pivots that the rest of your pattern and support work is built on.
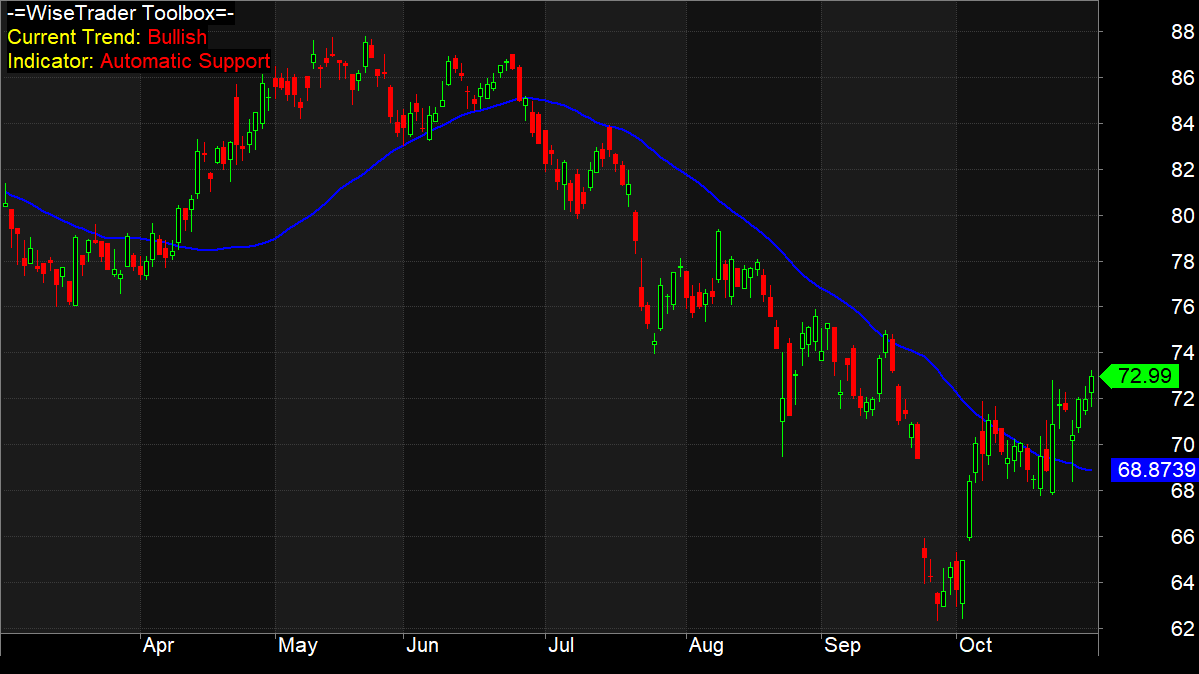
Automatic support
A support level is a price the market keeps falling to but struggles to drop below — buyers step in, so price tends to bounce. AutoSupport finds one for you and updates it bar by bar. At each bar it looks back over a window of prices, sorts them, and finds the cluster of values that sit closest together: the more prices that bunch near the same level, the stronger that level is, so it returns that cluster as the support line. A threshold sets how close two prices must be to count as the same cluster, and the look-back sets how much history it weighs. Because it works on any array, you can run it on price or on an indicator such as the RSI.
Automatic pivots
A pivot is a local turning point — a high with lower bars on both sides, or a low with higher bars. Pivots are the skeleton of price action: most of the pattern scanners in this Toolbox, and a great deal of support-and-resistance work generally, start by finding the pivots and then looking at how they line up. AutoPivots scans the array you give it and returns a flag that is set on each pivot bar, so you can plot markers, count turning points, or feed it into your own logic. A single trend setting controls how far a bar must stand out over its neighbours to qualify — larger values give you fewer, more significant turning points.
How you would use them
Drop the Automatic Support and Pivots charts straight on, or call AutoSupport() and AutoPivots() from your own formula to build support-aware entries, mark structure for a pattern rule, or filter signals to the neighbourhood of a real level. Both need a clean source array and a little history before the first value appears.