Adaptive Goertzel N-Cycle DFT
An advanced discrete Fourier transform that extracts the dominant market cycles and projects them forward.
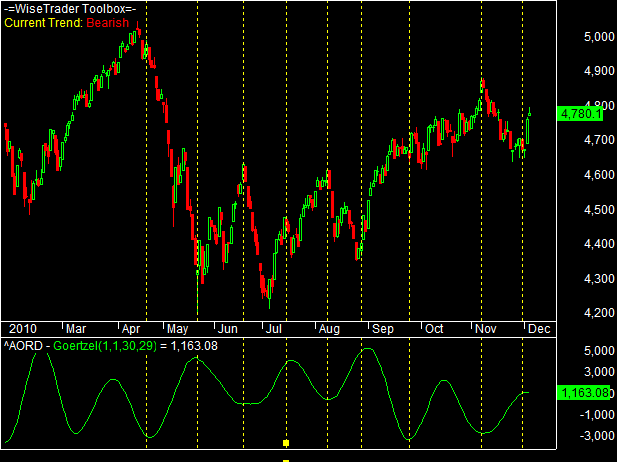
A Fourier transform breaks a signal into the separate cycles that make it up. The catch with the ordinary transform — the DFT, and its fast cousin the FFT — is that it can only measure cycles at fixed, evenly-spaced lengths; a real cycle that falls between two of those slots gets smeared across them. The Goertzel algorithm, first published by Gerald Goertzel in 1958, is a focused slice of the same maths that fixes this: it measures the strength of any single cycle length you ask for, exactly. It is the very algorithm a telephone uses to recognise which touch-tone button you pressed, and it holds up well even when the noise is as large as the cycle you are hunting for.
This indicator points that algorithm at price. It is built on the published work of Dennis Meyers and his Adaptive Goertzel-DFT system, generalised from his fixed ten-cycle method into a configurable tool.
How the Toolbox does it
Market cycles drift — they appear, fade and change length — so the indicator re-measures them on every bar rather than once. At each bar it takes a trailing window of price, removes its average level and straight-line trend so a strong trend cannot manufacture false low-frequency cycles, then uses Goertzel to measure every cycle length across the range you chose. It keeps the strongest few, adds them back together to estimate price a chosen number of bars ahead, and accumulates the result into a smooth running curve. Because only the strongest cycles survive, the random jitter is stripped away and what is left is the rhythm the market is actually moving on.
How you would use it
You watch the curve's slope and turning points, not its absolute level — a turn in the indicator marks a high-probability turn in price. A few parameters shape it:
- Cycle range — the shortest and longest cycle lengths to scan (from 6 up to 270 bars).
- Number of cycles (N) — how many of the strongest cycles to combine, 1 to 10. Fewer gives a cleaner curve; more follows finer detail.
- Projection — how many bars ahead to project the cycles.
The Toolbox ships it as a ready-made Goertzel N-Cycle chart, complete with a stop-and-reverse band-breakout system you can backtest and an Exploration for scanning a watchlist.
A word of caution
The transform needs enough history for the longest cycle to repeat about three times, so the analysis window must be at least three times your longest cycle. And like every cycle method, the most recent values update as new bars arrive, so a turn can look cleaner in hindsight than it did live. Cycle systems are also easy to over-fit: judge any system built on this only on data it was not tuned on.