End-Point FFT
A Fast Fourier Transform noise filter that, unlike a normal FFT, does not look into the future.
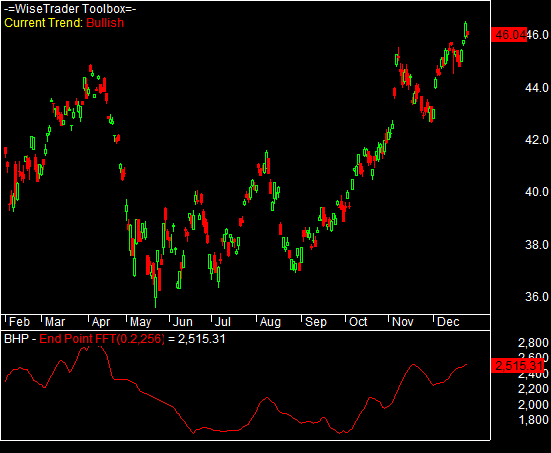
The End Point Fast Fourier Transform is a noise-filtered FFT rebuilt so that it can actually be traded in real time. At each bar it transforms a trailing window of price, drops the weak frequencies as noise, and keeps a single value — the end point. String those end points together and you get a smooth curve whose trend and, especially, whose turning points are what you watch. It comes from the published work of Dennis Meyers.
The FFT illusion
Why not just run one FFT across the whole chart? Because it will lie to you about the past. Fit a noise-filtered FFT over an entire history and the curve hugs every top and bottom beautifully, even seeming to roll over just before a big decline — as if it had predicted it. But that curve was drawn already knowing where the tops and bottoms were; the FFT's maths force a glove-tight fit to the data it is given. Re-draw it as it would have looked on the day of the top, using only the data available up to that day, and the apparent foresight evaporates. The smooth, prescient-looking whole-history FFT is hindsight, not prediction.
How the Toolbox does it
To get an honest curve, the indicator walks forward one bar at a time. At each bar it takes the log of the window so a strong trend cannot dominate, removes the average level and straight-line trend, runs the FFT, zeroes out every frequency weaker than your threshold, inverts the transform and keeps only the last point — the one value it could legitimately have known at that moment. Joining those end points reproduces what you would really have seen live. The honest cost is lag: instead of leading the turns it follows them by anywhere from zero to a few bars.
How you would use it
Focus on the curve's turning points — they are its most reliable feature. Two settings control it:
- Periods — the length of the FFT window (an even number, at least 8).
- Threshold — the noise-filter level between 0 and 1. Raise it for a cleaner, smoother curve built from fewer cycles; lower it to let more detail through.
The Toolbox ships it as a ready-made End Point FFT chart you can drop straight on. Like every walk-forward method here, the most recent values update as new bars arrive — so validate any system built on it out-of-sample.