Sine Wave
John Ehlers' cycle-phase display — a sine and a lead sine whose crossings mark cycle turns, and which stop crossing when the market trends.
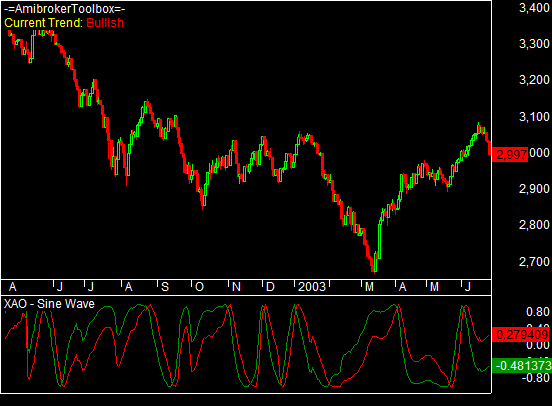
The Sine Wave is John Ehlers' cycle-phase display, from Rocket Science for Traders. Instead of plotting price, it works out where the market currently sits within its dominant cycle — the phase — and plots a smooth sine of that phase. Alongside it runs a second curve, the lead sine, which is the same wave advanced by 45°. Because both track the cycle's phase rather than its price, they keep a steady rhythm while the market is cycling, and the lead sine crossing the main sine flags a turn roughly an eighth of a cycle early.
What it does not do
The real value of the Sine Wave is the false signals it avoids. An ordinary oscillator throws off a stream of meaningless crossovers when a market trends; the Sine Wave does not. When the market stops cycling and starts trending, the two sine lines simply run parallel and stop crossing — and that flat, non-crossing stretch is itself a useful no cycle, trend mode tell. So it both times the swings in a cyclic market and warns you when cycle signals should be set aside in favour of a trend tool such as the Instant Trendline.
How the Toolbox does it
The Toolbox ships a ready-made Sine Wave chart that plots the sine and lead sine together in their own pane, where their crossings mark the cycle's turning points. The same calculation is exposed as a single AFL function for your own formulas.
Swap the DSP engine
Under every cycle reading sits a dominant-cycle estimator — the part that decides how many bars the market is currently swinging over. Ehlers' original public Sine Wave was wired to one method, the Homodyne Discriminator. The Toolbox makes that estimator a setting you can change, so you can pick the engine whose character suits the market rather than being stuck with the original. The earlier Sine Wave DC — the dominant-cycle variant — is now simply one of these engine choices rather than a separate indicator.
The available engines are:
- Homodyne Discriminator — the low-lag Ehlers default, and what the original public versions used.
- Ehlers alpha Dominant Cycle — a lighter phase-accumulation read you tune by hand; this is the old Sine Wave DC behaviour.
- Autocorrelation periodogram (Mesa) — a full spectral read, steady and well-behaved on real markets; the open basis of Ehlers' MESA approach.
- Burg maximum-entropy spectrum — the sharpest frequency resolution, best for telling apart two cycles that sit close together.
- Kalman cycle tracker — the lowest lag and the quickest to react when the cycle length changes.
- Concentrated-taper periodogram (Multitaper) — the steadiest reading in noisy, choppy data.
It matters because the newer spectral and tracking engines are more powerful than the Homodyne Discriminator the public versions relied on — sharper, more accurate, or faster to adapt — and you switch between them by changing a single setting, with the formula otherwise untouched.
How you would use it
Treat lead-over-sine as the cycle turning up and sine-over-lead as it turning down, and act on those turns only while the lines are genuinely crossing. The moment they flatten out and run side by side, lean on a trend method instead. It pairs naturally with the Toolbox's other cycle tools — read the rhythm with the Sine Wave, confirm it against the Goertzel and FFT, and trade the trend with the Instant Trendline.