Double Top & Bottom Finder
Detect double tops and double bottoms — major reversal patterns — straight from price.
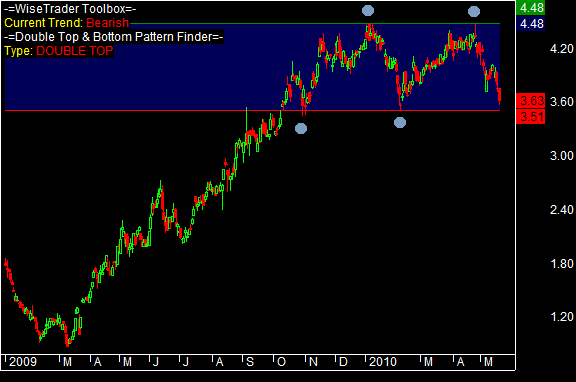
A double top is two peaks at roughly the same height with a dip between them — the shape of the letter M. Price pushes up to a level twice, fails both times, and that repeated failure suggests the uptrend is tired and may turn down. A double bottom is the mirror image, a W, where price tests a low twice and holds, hinting at a turn back up. They are among the more dependable reversal patterns precisely because they need the market to be rejected at the same level twice.
How the Toolbox does it
The finder reads the swing pivots from price and looks for the pair of equal-height tops (or bottoms) that make up the pattern. It then draws the support and resistance lines and shades the channel between them, so the formation is obvious on the chart. Run it as an Exploration to sweep a watchlist for every current double top and bottom, or apply it to a single chart; either way it labels each match as a top or a bottom.
Tuning the search
- Trend size min / max — the band of pivot sizes to accept, in percent. The finder returns every double pattern whose swings fall inside this range, so you can target small consolidations or large multi-month formations.
- Threshold percent — how close the two tops (or bottoms) must sit to the same line. Keep it small and both pivots must touch the level almost exactly before the pattern qualifies.