Head & Shoulders Finder
Find both bullish and bearish head-and-shoulders formations, with adjustable pattern size.
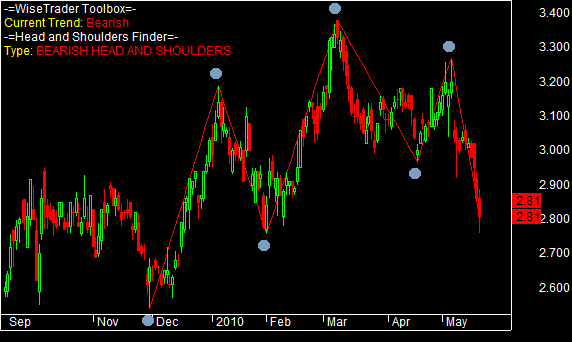
Head and shoulders is one of the oldest and best-known reversal patterns: three peaks in a row, a higher middle peak — the head — flanked by two lower shoulders, with a roughly level neckline drawn through the troughs between them. A close below the neckline is read as an uptrend running out of steam. Turn it upside down — three troughs with a lower middle one — and you have the inverse head and shoulders, which signals the opposite.
How the Toolbox does it
The finder locates the pattern straight from price, with no manual annotation. It first marks the swing pivots, then looks for the run of peaks (or troughs) whose heights and spacing fit the head-and-shoulders shape, and draws the neckline and the connecting lines so you can see the formation at a glance. It runs as an AmiBroker Exploration over a watchlist, or on a chart, and reports whether the match is a bullish or bearish formation.
Tuning the search
Two settings shape what it finds:
- Trend size — how far price must move, in percent, to count as a pivot. Larger values find bigger, slower formations; smaller values pick up shorter-term ones.
- Distance threshold — the maximum gap allowed between the two shoulders. Keeping this tight rejects lopsided, squashed patterns that tend to be less reliable.
Because the size is driven by these parameters, you can aim the scanner at intraday swings or at multi-month formations to suit your time-frame.