Fibonacci Retracement Finder
Scan for stocks that have retraced to a Fibonacci level, with adjustable retracement size.
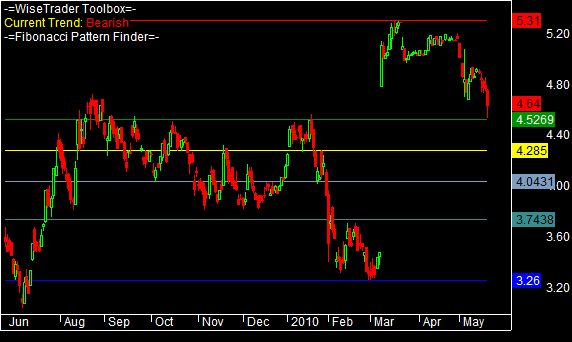
When a market makes a strong move and then pulls back, the pullback often stalls at one of a handful of well-known proportions of the original move — 23.6%, 38.2%, 50% and 61.8%. These are the Fibonacci retracement levels, derived from the ratios in the Fibonacci number sequence, and a great many traders watch them as likely places for price to find support and resume its trend. Whether they work because the maths is special or simply because so many people act on them, they are among the most widely followed levels in technical analysis.
How the Toolbox does it
The finder takes the recent peaks and troughs, lays the Fibonacci grid over the moves between them, and flags the cases where price has actually come back and touched one of those levels — rather than just drawing the grid and leaving you to judge. On a chart it plots the levels and the move they were measured from; as an Exploration it scans a watchlist for every symbol currently sitting on a Fibonacci level, and reports whether the setup is bullish or bearish.
Tuning the search
- Peak back — how many recent peaks to measure retracements from.
- Bars back — how recently the touch must have happened; set it to 1 to find only symbols touching a level on the current bar.
- Threshold — how close, in percent, price must come to a level to count as a touch.
- Trend size — how large a swing must be, in percent, to be treated as a peak worth measuring from.