Trendline Scanner
Search for almost any trendline — bullish, bearish, support, resistance, breakouts — automatically.
A trendline is a straight line drawn under a run of lows, or over a run of highs, so that it touches the price several times along the way. Traders read it as a moving line of support or resistance: while price keeps bouncing off the line the trend is intact, and a clean break through it can be the first sign something has changed. Drawing them by hand is slow and a little subjective — two traders rarely draw the same line — which is exactly the work this tool takes off your hands.
How the Toolbox does it
The scanner looks back over a window of bars and tries every candidate line that ends near the most recent bars. For each one it counts how many times price comes close enough to touch the line and how many times it cuts clean through, then keeps the line with the most touches that still passes your rules. It runs as an AmiBroker Exploration, so you can point it at a watchlist and list every symbol that currently has a qualifying trendline, or drop it on a chart to draw the line it found.
Tuning the search
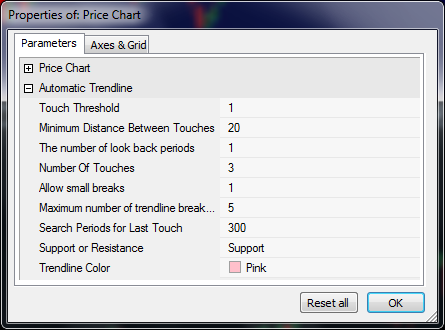
A handful of parameters decide what counts as a match, so you can hunt for exactly the kind of line you trade:
- Touch threshold — how close, in percent, price must come to the line to count as a touch.
- Number of touches — the minimum touches a line needs to qualify (at least two; it takes two points to make a line).
- Look-back — how many bars ago the last touch may be, so you can find lines being tested today or ones that were active recently.
- Allow small breaks and a maximum breaks count — let price dip through the line a few times and still treat it as valid, the way a real support line behaves.
The same engine is exposed as a single AFL function, so you can fit a line to an indicator such as the RSI instead of price, or build the search into your own scan.